
Migrating Netlify’s Continuous Deployment infra to Kubernetes (and everything we learned along the way)
During 2017, Netlify suffered a series of incidents that made us reconsider the way a key component in our infrastructure works. This post is about the journey we took to make our service more resilient. I’ll also share some thoughts that hopefully will help you approach risk and safety management from new points of view.
The need for certainty
One common issue among the incidents I’ll describe is that we weren’t certain about what triggered each one of those events. Humans, in general, prefer simple explanations that point to specific causes because it means that a single change may be sufficient to correct the problem.
In Nietzshe’s words:
Extracting something familiar from something unknown relieves, comforts and satisfies us, besides giving us a feeling of power.
— Friedrich Nietzsche, Twilight of the Idols.
He was talking about his fellow philosophers here, however, I think we all can relate to this feeling when we talk about incident investigation and outages. We tend to stop when we find a reasonable explanation to the event with familiar terms. Having a good understanding of the issues make us also feel like we have the system under control again.
Unfortunately for us, we didn’t have simple and reasonable explanations for those events. Which led us to start thinking about ways to replace the whole system.
Systems thinking
For those of you not familiar with Netlify, it’s a platform for building, deploying, and managing JAMstack projects. We give frontend developers a modern workflow that combines globally-distributed deployments, continuous integration, and many other features for the modern web.
The system that concerns us here is the one in charge of building and deploying customer projects. Its only purpose is to take the source code that lives in a Git repository, run some build commands to generate all the files we need to deploy, and upload those files to our origin servers.
This diagram represents the architecture of the system that was in production between 2015 and January 2018.
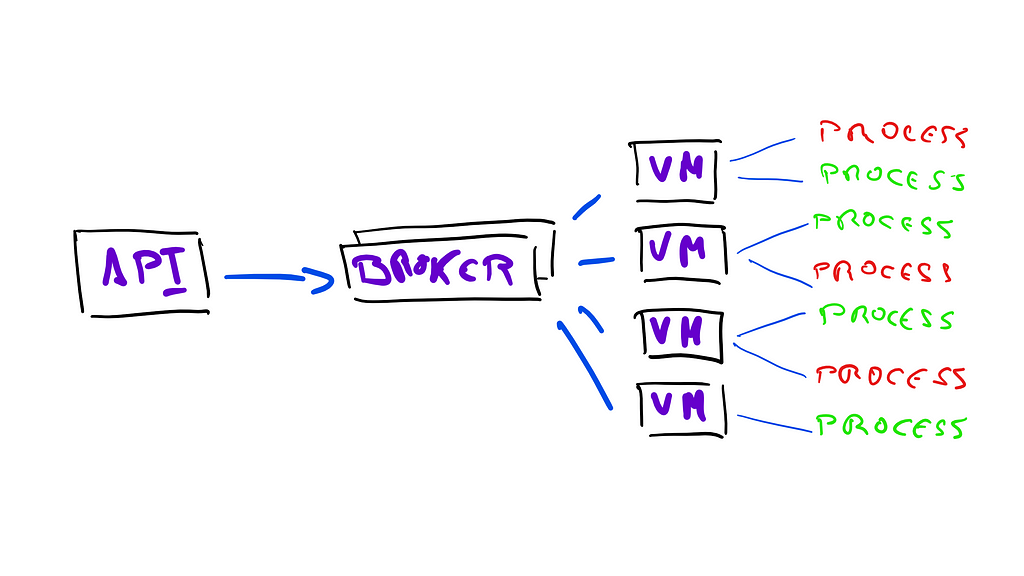
Our API receives events from different Git sources, like GitHub. It stores information about this event in a database, and sends a message to a broker queue. On the other end, a microservice deployed in a cluster of virtual machines listens for messages in the queue. Upon receiving a message, it starts a docker container that runs the build process necessary to generate a new deployment.
Capacity Management
The first challenge we faced with this architecture was capacity management. As our customer base increased exponentially, the demand for infrastructure resources increased in the same fashion. This new traffic in our build network caused degradation of service on several occasions, which made us consider the different strategies for capacity planning.
At the beginning, we started using a lead strategy. We increased the number of VMs with the goal of being over-provisioned, without paying attention to the traffic. That was a good solution to start with because we had several thousands of credits in different cloud providers and we didn’t have to be concerned about paying those bills.
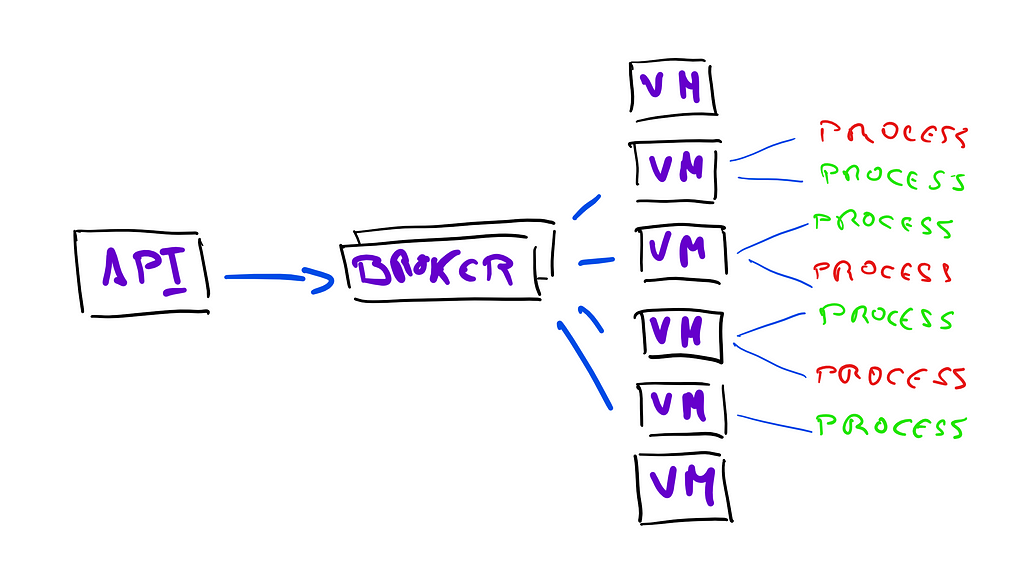
The problem with this strategy is that we used arbitrary numbers with the hope that it’d be enough to keep up with demand. This was also a waste of resources on a daily basis, because the traffic that goes through our network on a Monday morning is completely different from that on a Saturday night.
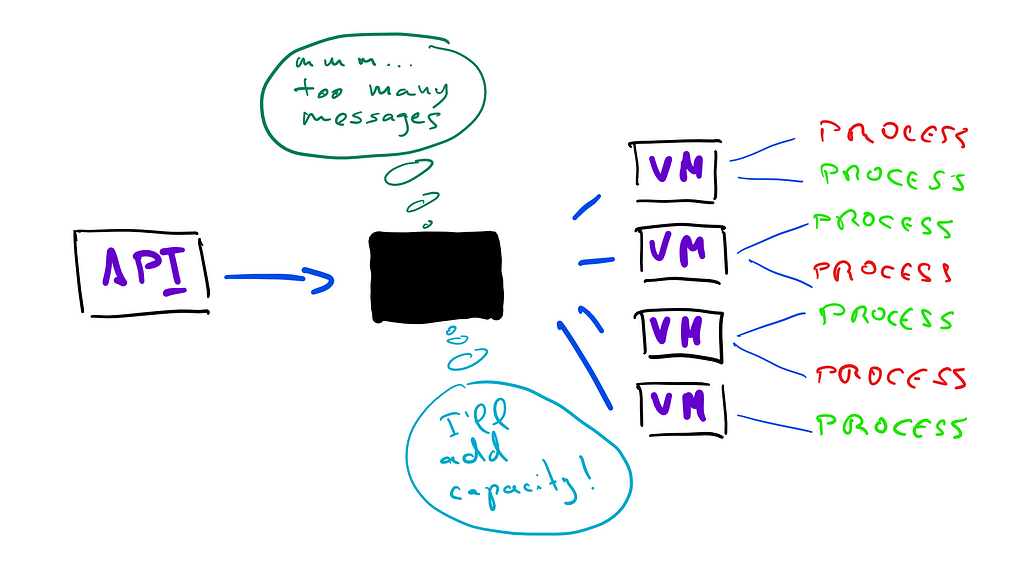
The bad news is that being over-provisioned today doesn’t mean anything tomorrow, and every now and then, we woke up to alarms of traffic spikes and build queues backed up as a result. Our responses to these events were always reactive to match the spike of traffic, without having simple explanations for why they happened.
Increasing capacity in this way is known as lag strategy. It’s a more conservative strategy that doesn’t yield good results, since you usually wait until there are delays in your system to add more capacity, eroding confidence in the service as a whole.
What we really needed was a system that could adjust the capacity to match demand in each situation, and do it in an automatic way, without us having to worry about how expensive it was, or how many customers were experiencing delays in their deploys.
Observing Normal Accidents
Delays in building and deploying projects was not the only problem we faced with this old system. Other issues landed in the area of what’s called normal accidents, or system accidents.
Charles Perrow presented this theory in his book Normal Accidents: Living with High-Risk Technologies, where he proposed that technical systems become so complex that unanticipated interactions of small failures are bound to lead to unwanted accidents and disasters.
In the distributed systems world, we can see this theory in action in the work of Kyle Kingsbury with the Jepsen project. The most clear examples of this type of accident are network partitions that trigger byzantine errors in distributed systems. Once again, we’re reminded that networks are not reliable — we cannot count on having reliable message-passing through networks; therefore, we should design our systems to be partition tolerant.
During 2017, our build system suffered several network partition accidents. These errors manifested in different ways, from lost messages in the queue, to split brain events in which we had to completely recreate our message queue cluster to recover from them. The worst part was that we could not find simple explanations to these events, which only increased the uncertainty of the system. The queue broker we were using didn’t provide any useful metrics, and even when we configured the system to always emit debug logs, we could not get any information whatsoever about the events.
These incidents were the main issue that made us consider migrating our build system to a completely different architecture. We needed a system that gave us stronger guarantees in case of normal accidents, and allowed us to observe and reason about them without the pressure of a customer-impacting incident in progress.
Circuit Breakers
The most common technique to handle these types of incidents is to put circuit breakers in place.
You wrap a protected function call in a circuit breaker, which monitors for failures. Once the failures reach a certain threshold, the circuit breaker trips.
— Martin Fowler, CircuitBreaker
A circuit breaker is an abstraction in your code that forces you to define how your code is going to behave in case of system errors. It includes heuristics to decide whether to run your intended code or to fall back to code that handles errors. For example, you can define that if an action fails 30% of the time, then you should stop trying to perform that action and instead do something else.
We added circuit breakers to decide what to do in case of network partitions — if a service cannot talk to another through the network, we need to decide how to handle that problem. In this particular scenario, we used circuit breakers to stop sending messages to the message broker if our API could not reach it. The code looked like this:
During network partitions, we stored all messages in a secondary store until we recovered from the incident. At that point, we re-enqueued the messages in the order we received them. This gave us the confidence that we didn’t miss any messages during an outage, and we could recover from the incident by responding to those messages in a more controlled manner.
However, the big question that we still had to answer was how we could prevent all these incidents from happening in the first place.
The rise of Kubernetes
We evaluated different solutions to the problems we faced with our build system. For a more conservative approach, we could replace our queue system with a different one that had been proven more reliable. This could help us mitigate normal accidents, but it didn’t solve our capacity planning issues. We also considered writing a custom scheduler and load balancer that could adjust capacity based on user demand. This could solve our capacity issues, but of course, it wouldn’t help mitigate normal accidents. Plus, we’d have to spend time finding and developing the right solution, and it could also introduce new unknowns.
We needed a more pragmatic solution. Our team is not very big, so we had to consider the time we’d spend building and managing a new system. We re-assessed the problem as a whole, and looked for existing technologies to meet our needs. We had three requirements:
- - Proven stability against normal accidents.
- - Ability to schedule jobs, maximizing CPU and memory efficiency.
- - Automatic capacity adjustment, adding and removing resources on demand.
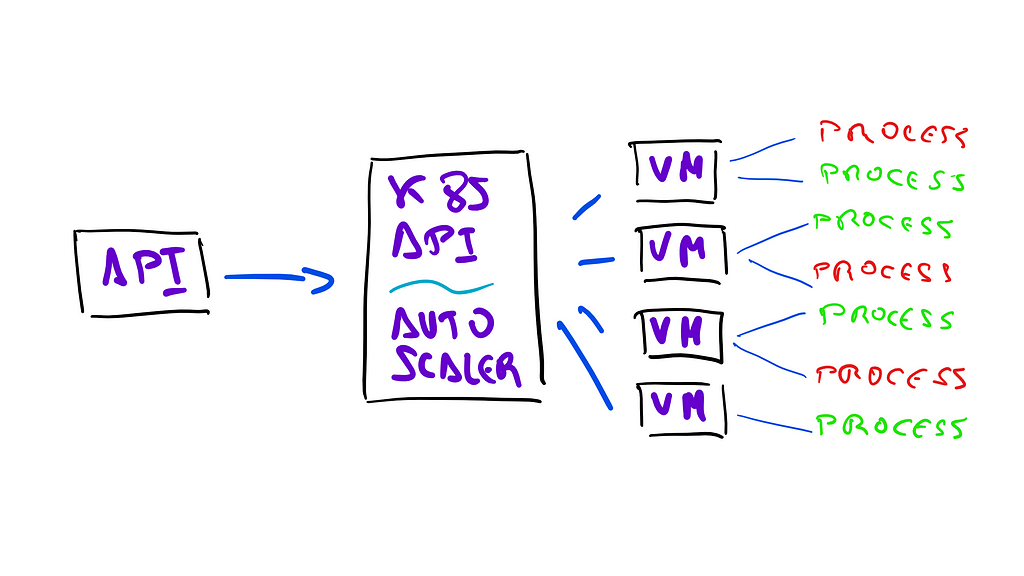
This made us look into Kubernetes. Today, there is an enormous amount of information about Kubernetes out there, and the community is only growing. This gave us confidence that in the event of an accident, we could find good solutions. We also decided to use the managed service of one of our cloud providers, instead of managing Kubernetes ourselves. This meant that experts in the field could help us make it reliable while we focused on our own system problems.
After some experimentation, we were fairly certain that we could use the Kubernetes API to schedule pods to run our builds and deploys, and we could also leverage the Kubernetes Autoscaler to manage the cluster’s capacity automatically for us.
At Netlify, we’re not exactly fans of the idea of “build a huge new system, switch it on, and hope for the best. We had a migration plan in place to help us evaluate our progress and ensure that the new system could make our build service more resilient.
The ETTO Principle
Erik Hollnagel published a theory a few years ago on the trade-off of being efficient versus being thorough. In his book, he explained that it’s impossible to maximize efficiency and thoroughness at the same.
The ETTO principle refers to the fact that people (and organizations) have to make a trade-off between the resources they spend on preparing an activity and the resources the spend on doing it.
— Erik Hollnagel, The ETTO Principle
In other words, we needed to make a trade-off between the time and effort we spent designing and testing the new system versus the time customers could be spending on the new, presumably better, system. If we chose thoroughness and took longer to migrate to the new system, we could face new accidents in our old system, which would erode the customer confidence and risk our SLAs. If we chose efficiency, we could have migrated to the new system quickly, but face many unknown system accidents, which would have risked our SLAs too.
Feature flag all the thing
We use feature flags across our platform extensively. They allow us to expose customers to new features in a controlled manner. But what’s more important to us is that they also allow us to put features in production and expose them for our use only. I’m a big proponent of testing in production when done right, and feature flags are a fundamental part of it.
Once new code is deployed to production behind a feature flag, it can then be tested for correctness and performance as and when required in the production environment.
— Cindy Sridharan, Testing in Production the Safe Way
A good feature flag system gives you the confidence that new parts of your code are only visible under certain conditions. It turns a feature on and off instantly on demand, and in a selective way. It should also tell you how many users a feature is enabled for and how often a customer reaches that feature.
At Netlify, we specify feature flags at three levels: global flags, account flags, and project flags. Those levels propagate on cascade — a flag enabled for an account applies to all projects within it, and a flag enabled globally applies to all projects in all accounts. We can also enable flags for a percentage of accounts and projects, as well as creating groups based on characteristics, like only accounts owned by teams.
The first step to migrate to our new build service was to define a feature flag that could route traffic to this service. At the beginning, the flag was only enabled for a few developers working on the service. When we started to get comfortable with the new service, we enabled it for the company web projects. The code for this feature flag looked like this:
Planning rollbacks and recoveries
Once we had a feature flag in place, we needed to consider our options to rollback traffic from the new service to the old service in case of unexpected accidents.
We started by storing metadata about which service had been used for each build, so we could identify affected customers. With that information at hand, our API could replay builds in the old service if we had to roll back and recover due to issues with the new service. From the point of view of an affected customer, they’d see Netlify failing to deploy one of their builds and automatically starting it again. The code for this logic looked like this:
Challenges scaling the service
At the same time we were building the service, we ran several load tests to ensure that Kubernetes’ autoscaler would work correctly, scaling up in the event of increasing build demands, and scaling down during low traffic times, like weekends.
This is the point were we bumped into our first complication. The autoscaler took too long to bring new nodes up when it needed to increase capacity. When Kubernetes adds additional capacity, the scheduler doesn’t send jobs to the new nodes until the docker images for those jobs are completely downloaded in the node. In our case, there is only one image to download, but that image’s size was 4 gigabytes, which took about 9 minutes to download. This was unacceptable as a capacity management measure, since many customers would be waiting for at least 9 minutes to get their builds started.
Specialized vs. general-purpose Docker images
If you’re familiar with Docker, you probably know that building images specialized for a specific purpose is usually a good practice. For example, you have an image for Nginx and its only purpose is to run Nginx. You also have an image for Go, and its only purpose is to run Go commands, and so on. In traditional Continuous Integration services, this is very convenient — if you want to run tests for your Rails application, you use an image with Ruby and Rails installed, and nothing else. This also helps keeping the image sizes small, which is more efficient when you have to download them many times from a container registry.
The nature of the projects our customers build on Netlify actually makes this less convenient. Usually, a web project will involve some JavaScript compilation, so we need Node. It might also need another programming language if you use a site generator, or libraries to process image files. Having a specialized Docker image would actually be a disadvantage for us because our customers would have to modify them for each one of their use cases.
However, we could improve how we installed packages in our image. At one point, we had five different versions of Ruby installed by default, and several versions of Python. To reduce size, we removed everything that didn’t need to be installed as root, and implemented several ways to lazy install those packages. For major the programming languages that we support, we use specific package managers like NVM and RVM to install Node and Ruby versions on demand. After the first installation, this version is stored in a local cache, so the next time this customer needs it, it doesn’t need to be installed — we fetch all the libraries from the cache, already compiled for the right system.
This work reduced the size of the image by about 2 gigabytes, but it still took several minutes to install the image. The problem was that even though Docker downloads layers in parallel, the process to build the image from those layers is sequential. As of this writing, our image includes 74 layers, and uncompressing those layers took much longer than downloading them. Fortunately, Docker includes a new squash utility that collapses all the layers in your image into a single layer. When we make changes to the image, we use Jenkins to squash the layers and push it to our private registry. Using a squashed image reduced the time it took for a new node to be ready to accept jobs from minutes to seconds.
Disk saturation
After some favorable results with the autoscaler, we decided to turn the feature flag on for a small percentage of our customers. This worked pretty well, and we started to see very promising results. Customer builds and deploys were going through the new service, and we even noticed a small drop in deploy times. So we enabled it for a higher percentage of customers.
At this point we started to see some very weird behavior. Every now and then, Kubernetes killed the Docker daemon along with all the containers running in that node, causing builds to be aborted in the middle of the process. We were very puzzled by this behavior.
We traced that behavior to a script for monitoring container runtime in GCE:
https://github.com/kubernetes/kubernetes/blob/master/cluster/gce/gci/health-monitor.sh#L27
This health-monitor script uses the docker ps command to decide whether a node is healthy or not. If that command takes longer than 60 seconds to reply, Kubernetes considers the node unhealthy and restarts the Docker daemon. However, there was a known problem where docker ps would hang indefinitely for reasons that were never very well understood. If you google “Docker ps hangs”, you’ll get about 30,000 results back.
Docker solved the problem in version 1.13, but because our service provider managed our cluster, updating the Docker daemon was not an option. Instead, we would have to figure out why our docker ps commands were hanging, and prevent it. In our case, the cause was that the node’s disk was saturated due to jobs manipulating too many files.
We found an alternative solution by mounting two different disks in each node. We use one disk for the Docker filesystem, where Docker stores information about the containers running. We use the other disk for our own workloads, where customers run their build commands.
Once we moved to a double disk configuration, we stopped observing disk saturation and daemon restarting issues. With this change in place, we turned the new service on for all our customers. Weeks later, we decommissioned the old service and removed the code that scheduled builds in it from our production API.
Afterthoughts
At the beginning of this project, we estimated that it would take us two months to migrate to Kubernetes. In the end, it took us about four months to finally put it in full production. The main two causes for this delay were:
- - Bumping into unknown accidents that we had not planned for.
- - Not having direct access to the Kubernetes cluster management.
On the other hand, both of these issues had benefits as well. Some of the accidents we bumped into forced us to improve parts of our infrastructure that we had neglected for some time. Delegating cluster management to a service provider shielded us from other types of accidents that we didn’t have to worry about.
In the six months since we migrated our build service to Kubernetes, we’ve suffered zero system accidents in the service. The times where the cluster was under-provisioned, the autoscaler worked as expected and automatically increased capacity without customers noticing any impact. An interesting byproduct of this is that we can now observe and reason about these autoscaling events without the time pressure and communication requirements of a customer-impacting incident.
Also in the last six months, the number of builds we process has grown by 50%. However, the direct cost of our build service has remained stable — we’re spending only about $200 per month more than we were before. If we had kept the old service, our expenses would have increased at the same rate the traffic increased.
This is not the end of the journey for our build service, and we’re now in a better place to take it to the next level. If you’re interested in challenges like this, we’re hiring.
Migrating Netlify’s Continuous Deployment infra to Kubernetes (and everything we learned along the… was originally published in Netlify on Medium, where people are continuing the conversation by highlighting and responding to this story.